The Connected Chelmsley project, overall, looks at mapping Chelmsley Wood to think about how people live, work and play in and around Chelmsley Wood. Our group focused on Environment and Ecology.
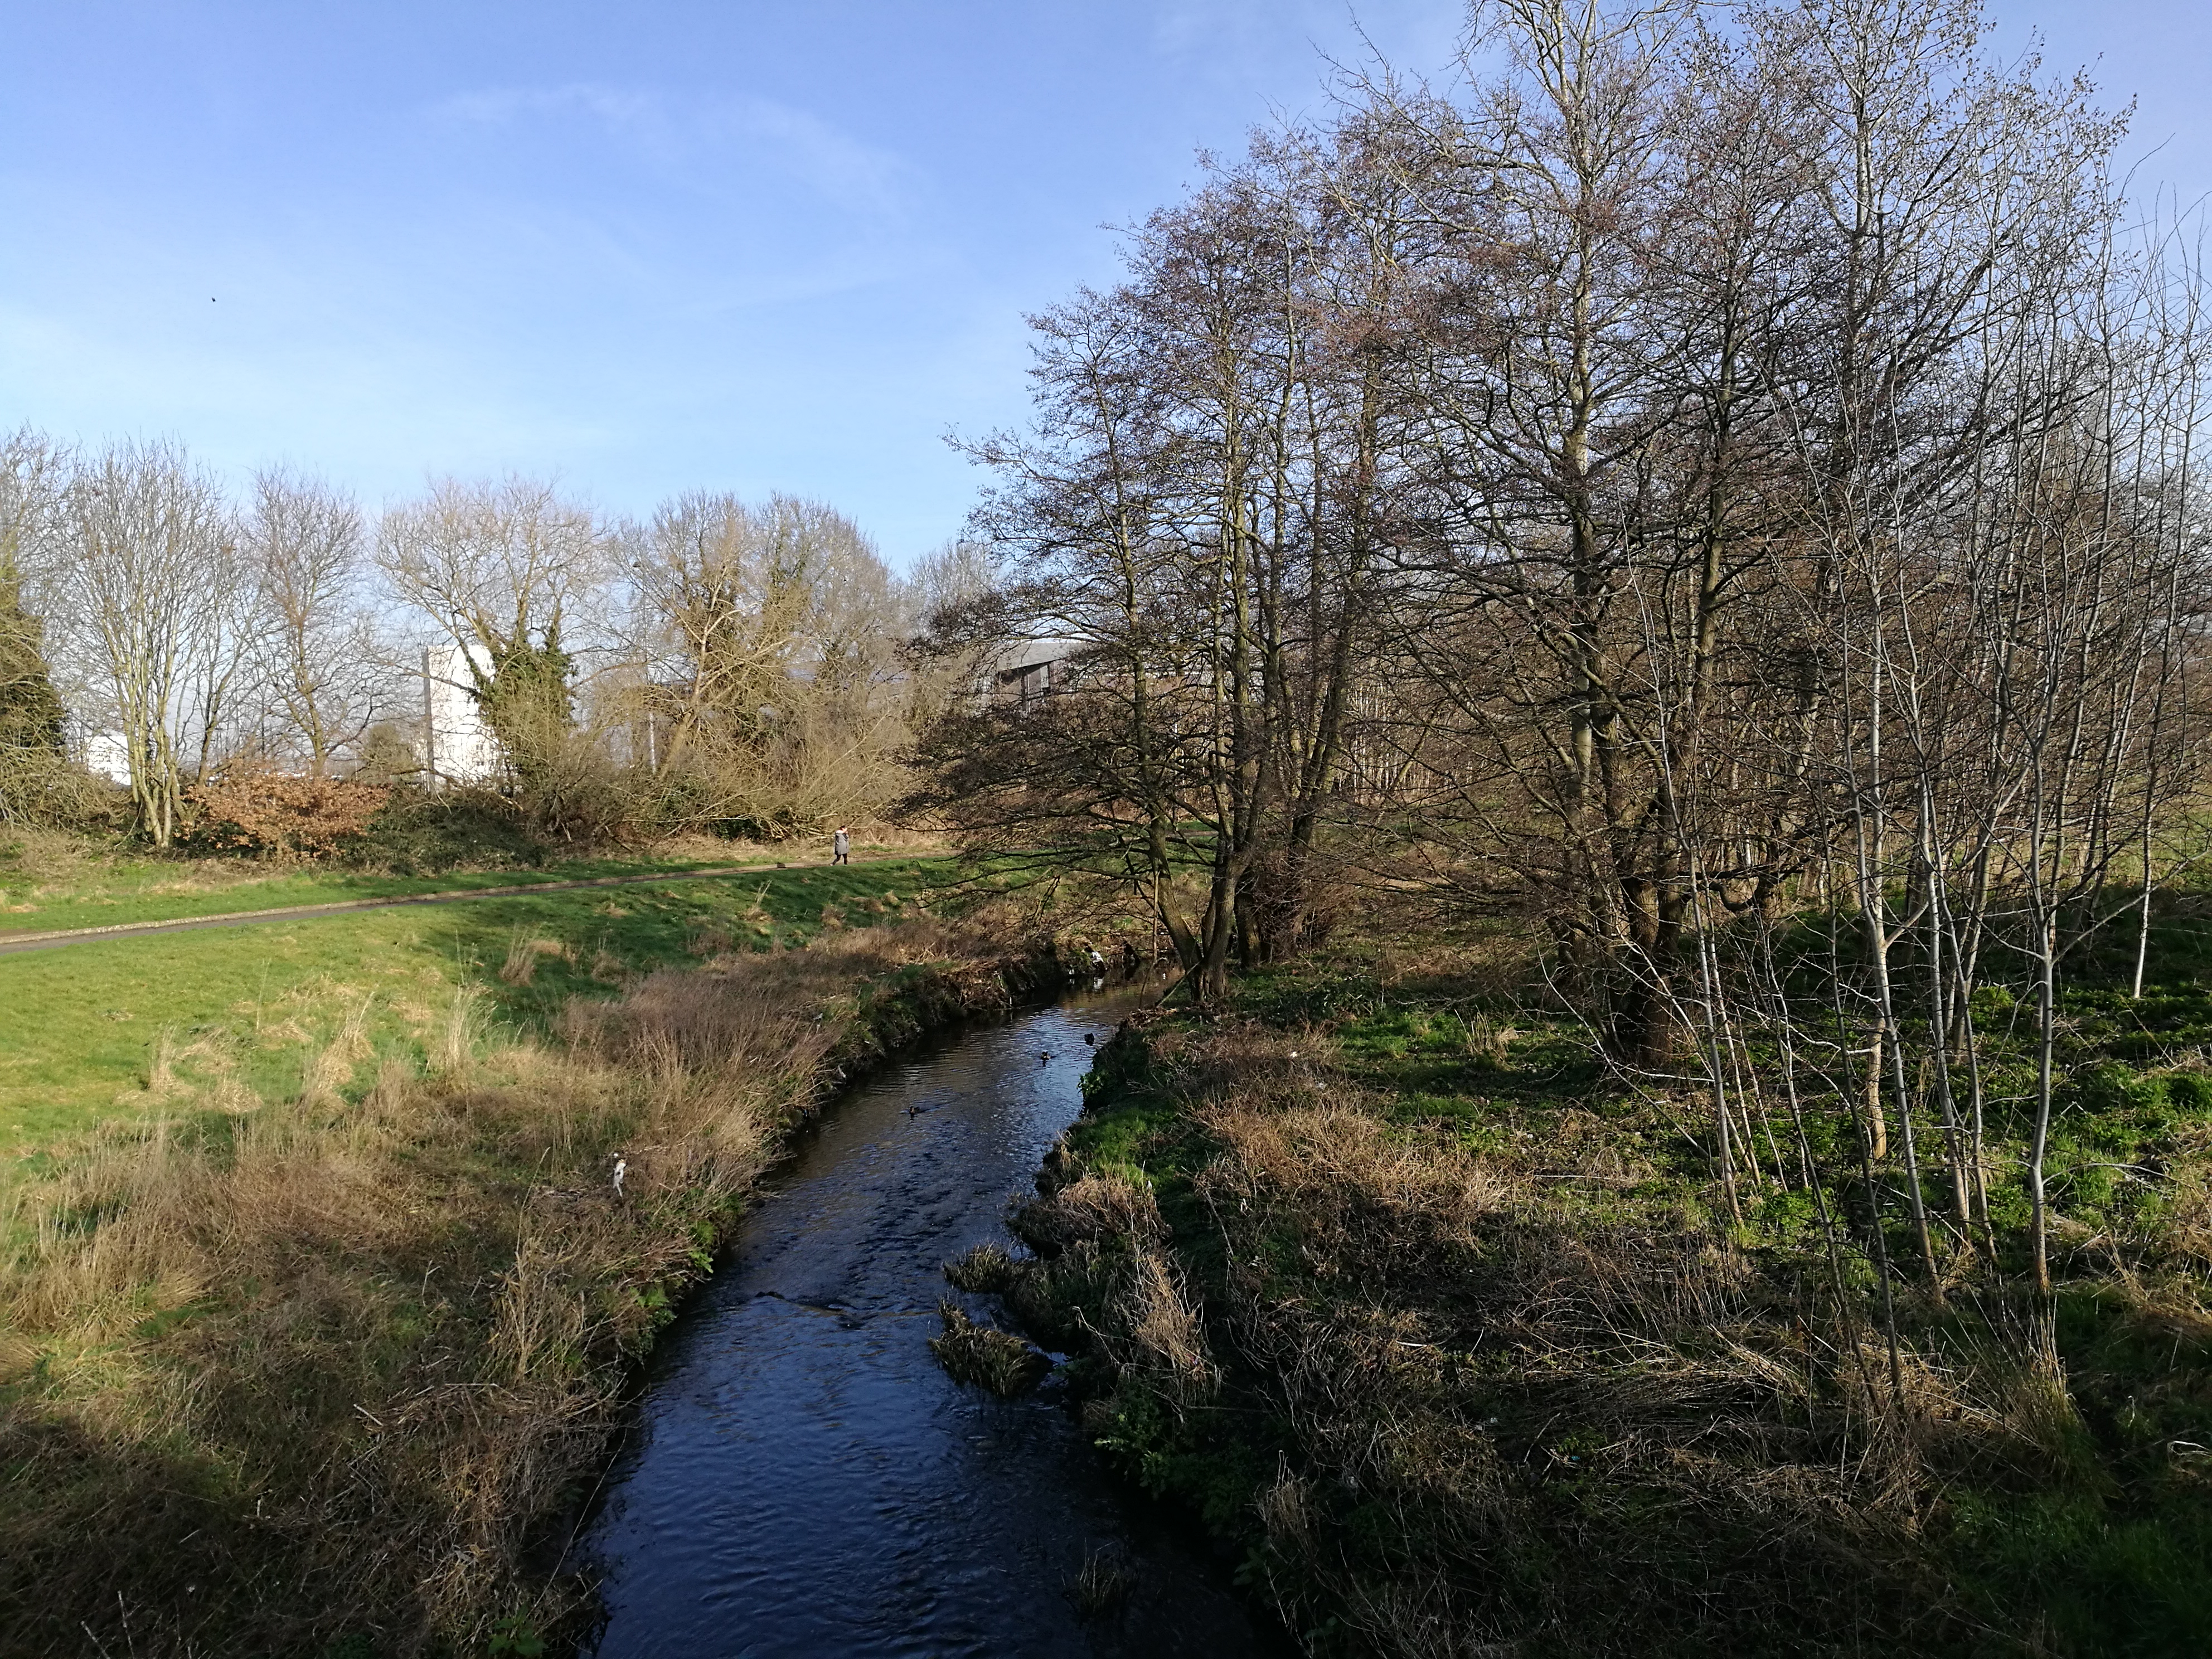
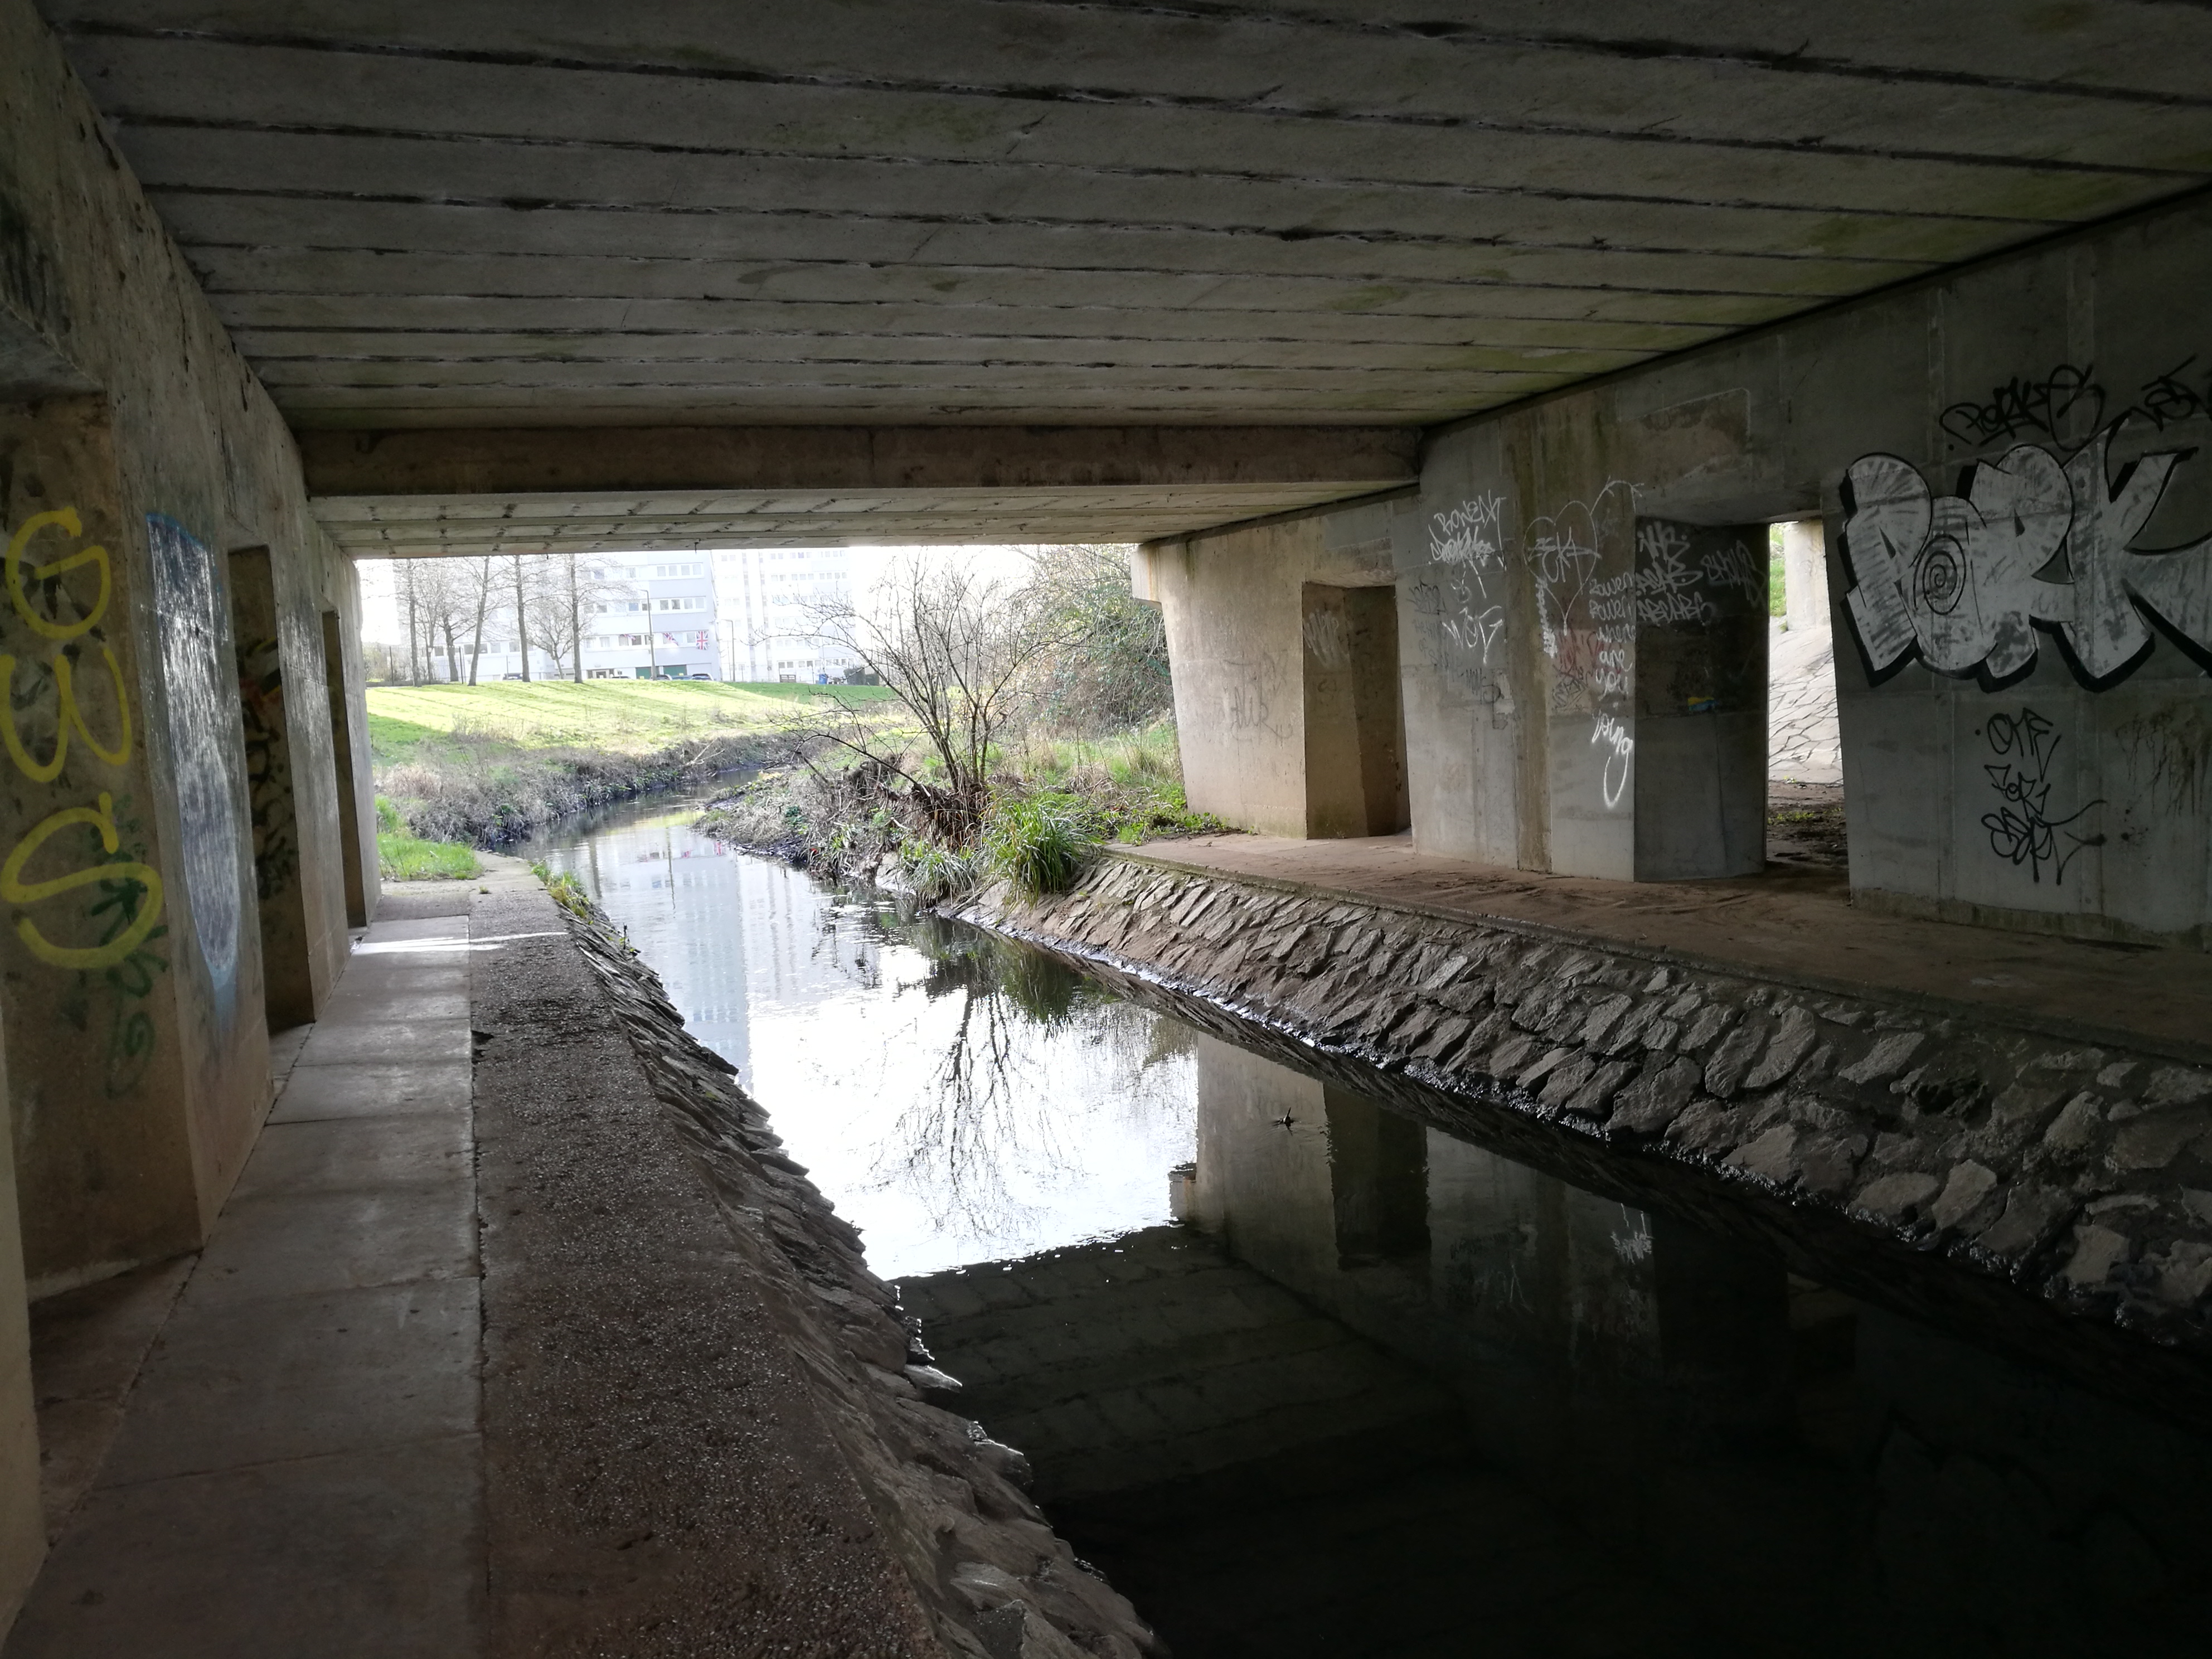
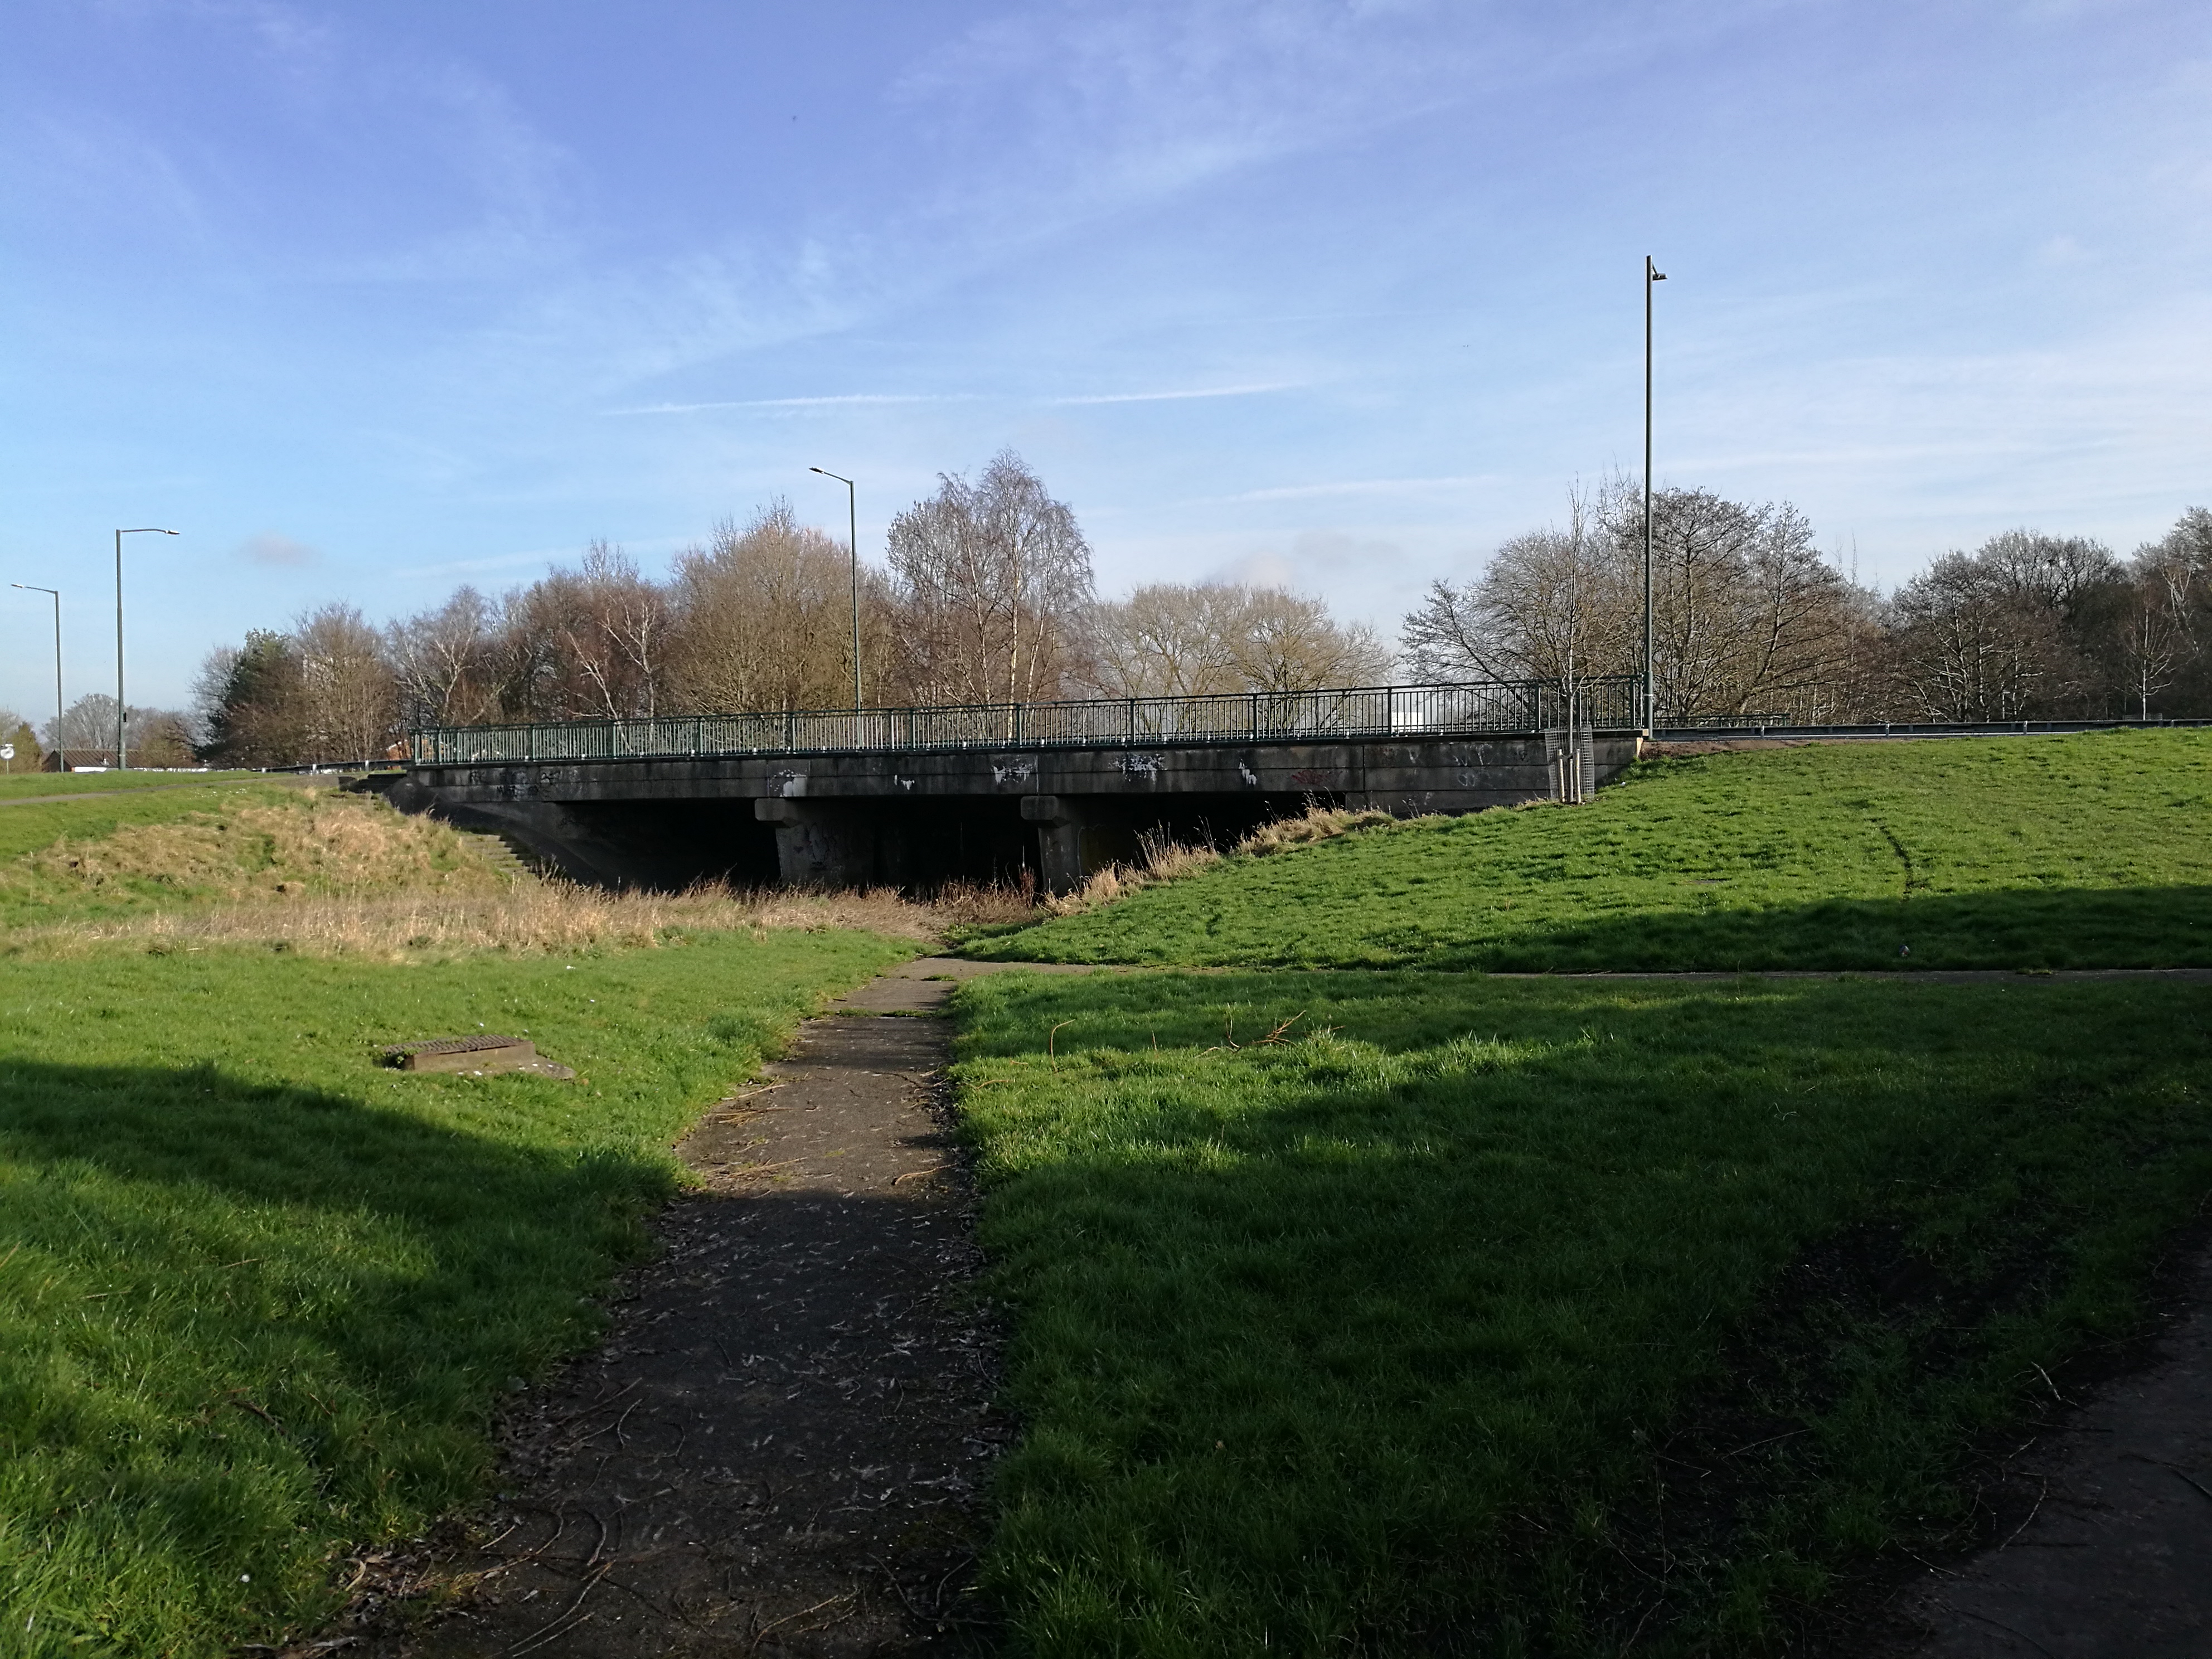
In the first session we visited Chelmsley Wood. During our site visit we recorded what we saw through notes, sketches and photographs.
After visiting the site we all started mapping our observations. During our initial mapping we all worked from different perspectives. It was interesting to see how, as individuals, our perception of Chelmsley Wood was very different. It was important to notice that we were recording and understanding a place from an ‘outsiders’ perspective and this would have an impact on how we recorded and understood our observations. During our site visit, we recorded what we saw on that day, at that time and in that moment. This would, most likely, be very different if we had been there on a different day at a different time or were a resident of Chelmsley Wood.

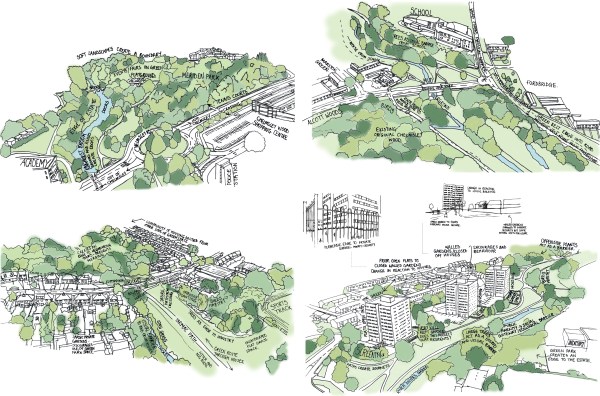
After discussing our initial observations, we began to understand how our styles, types and labels of recording could portray Chemlsey Wood very differently. Looking at the site from an aerial view and through photographs provided a much more humanistic approach to revealing the site as a place. When looking at the site in a plan view it was difficult to understand scale and massing. The plan view, did, however allow a greater area to be mapped at once – using aerial views and photographs cuts up the site, revealing moments in time rather than showing connectivity to the wider context. We needed to focus our mapping ideas and styles more.
In order to focus our mapping more, we explored ‘key terms’. Our group looked at the terms Ecology, Typology and Mobility. After working through our initial ideas of each of the terms collaboratively in groups, we individually consolidated and developed the terms to be shared in the group through discussions. As well as reiterating the definitions of the terms, this exploration helped us to develop new and interesting ideas for ‘layers’ we could map.

Mind-map of Mapping Layers ideasAfter reviewing our initial mapping and key term definitions we had a better idea of how we would move forward with our mapping. We used our key terms in relation to our topic ‘Environment and Ecology’ to create layers for our maps. We selected the same site area to focus on within our group. We believed this would focus our ideas and make our information easy for others to understand. We each developed a map which focused on our key terms and developed the styles and techniques collaboratively through sharing ideas on Trello.
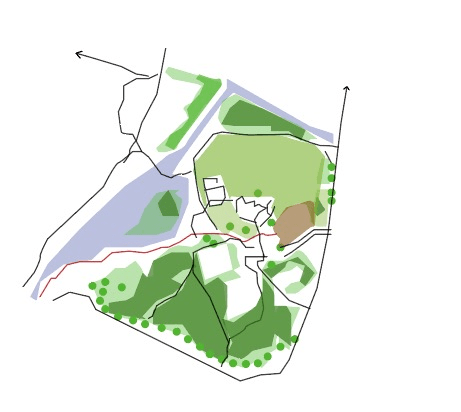
By Ziyi ChengThis sketch diagram started to explore the term Ecology. After researching the recorded ecology on Digimap, we started to zone different areas with their prominent ecology. This techniques of mapping worked well to cover large areas of the site and give an overview of the types of species of trees and plants which grew in different areas, however needed to be worked into in more detail. We thought about overlaying the map onto our other studies of mobility and typology in order to create a comparison or pick smaller areas we could study more closely and add to the map.
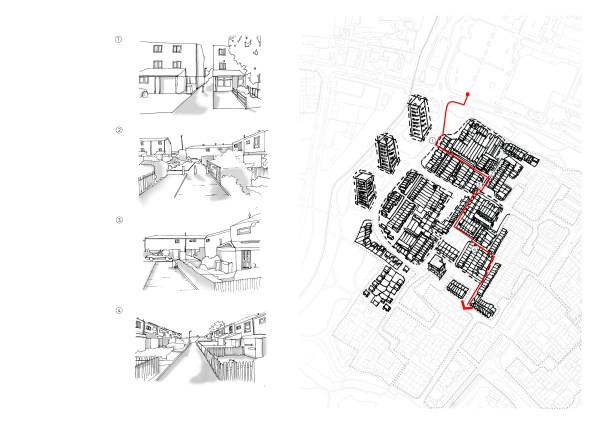

By Anita BrindleyThese maps explore mobility. Using serial vision studies allowed us to explore different routes through the site area. By using a plan view map and perspective sketches from eye level you get a good idea of the site as a whole. The first serial vision takes a route ‘through the neighbourhood’ and the second a route ‘along the green belt’. By taking routes through two different areas across the site creates a comparison between different walkway typologies. These studies reveal a lot about the site, however as you are choosing the points where you take the perspective sketches and how many you complete, you can question why the positions of the sketches have been chosen and whether this affects the outcome of the analysis. There is a potential for important areas of the routes to be missed.

By Zorays AlamWe explored the term Typology through axonometric diagrams. When paired with the sections of each type and a site map of the area with Type 1, 2 and 3 labelled we were able to clearly explain our ideas about the different walkway typologies throughout Chelmsley Wood. In the same way the perspectives in the serial vision studies explored the ideas from eye level, the axonometrics provided a way people who didn’t read “plan view” drawings all the time to understand our ideas. We started to realise the importance in finding ways to engage with the public and putting participation at the forefront of our maps. Although both these mapping ideas brought our mapping away from plan views, which are more difficult to understand, we realised there may also be a difficulty in relating one drawing to another; moving forward we want to find ways we can combine both maps and axonometrics to enable easier reading.

You must be logged in to post a comment.